Weather in Sovereign Harbour, Eastbourne
Live climate conditions at the brxnet.org weather station in Sovereign Harbour, Eastbourne, East Sussex, UK.
| Time | Temp (°C) | Wind avg (mph) | Wind dir | Gust (mph) | Rain (mm) | Pressure (hPa) |
|---|---|---|---|---|---|---|
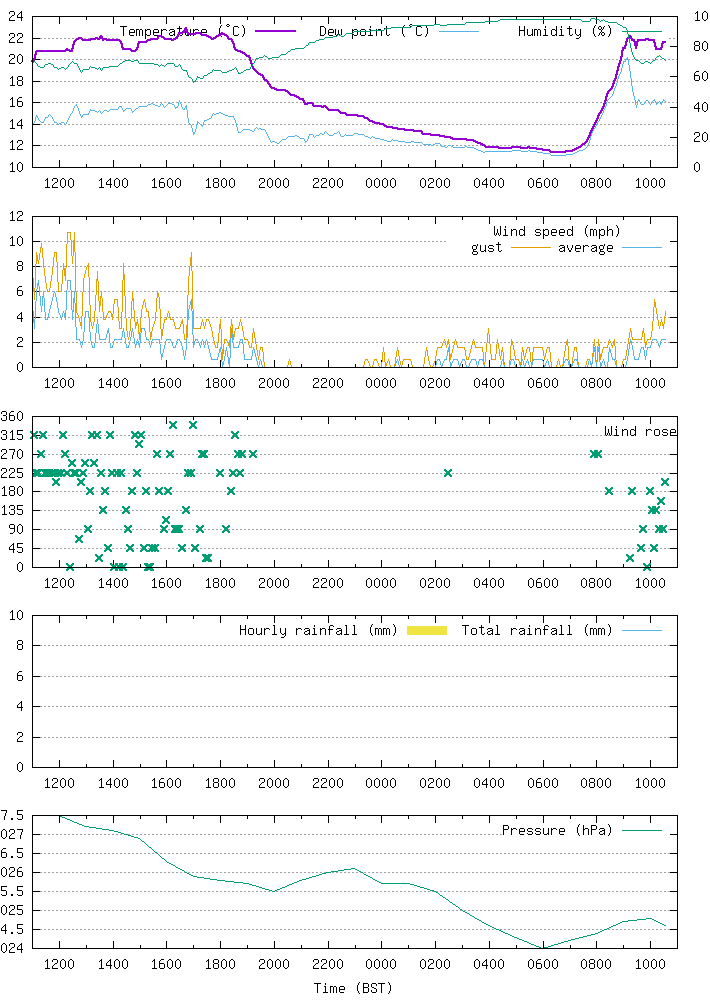
| 1034 | 21.6 | 2 | SE | 5 | 0.0 | 1025, rising slowly |
| 0959 | 21.8 | 1 | NE | 3 | 0.0 | 1025, rising slowly |
| 0859 | 21.0 | 0 | SW | 2 | 0.0 | 1025, rising slowly |
| 0759 | 14.2 | 0 | WSW | 2 | 0.0 | 1024, steady |
Station Decommissioned
The brxnet.org Sovereign Harbour weather station has been decommissioned after nearly nine years of collecting weather data.
It has been a fun ride, and I have learned lots along the way. Thanks for joining in, and I hope it has been a help to you. In the fullness of time I plan to be setting up again in a new location.
Forecasts: WindGuru | MetOffice (mob) | WeatherUnderground | BBC
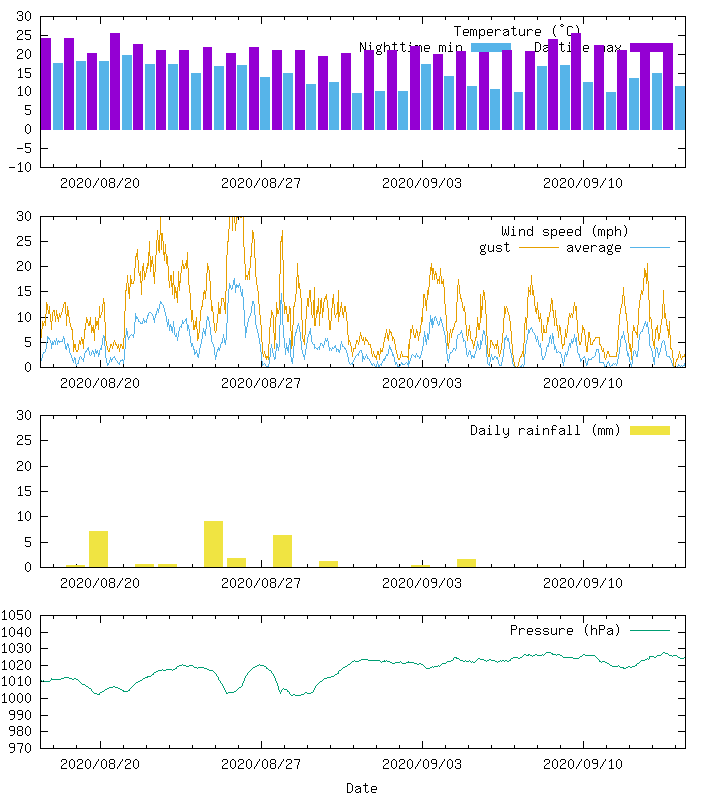
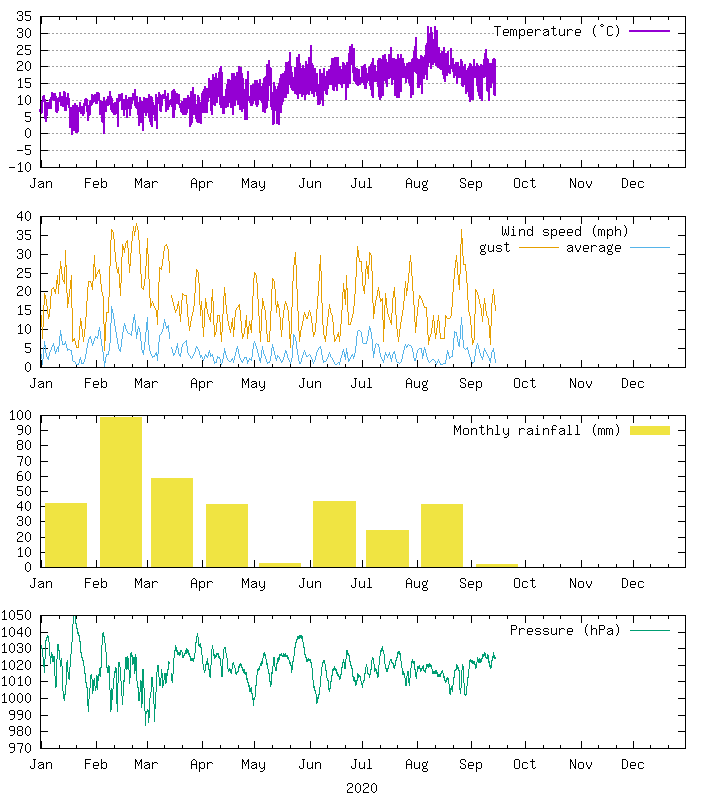
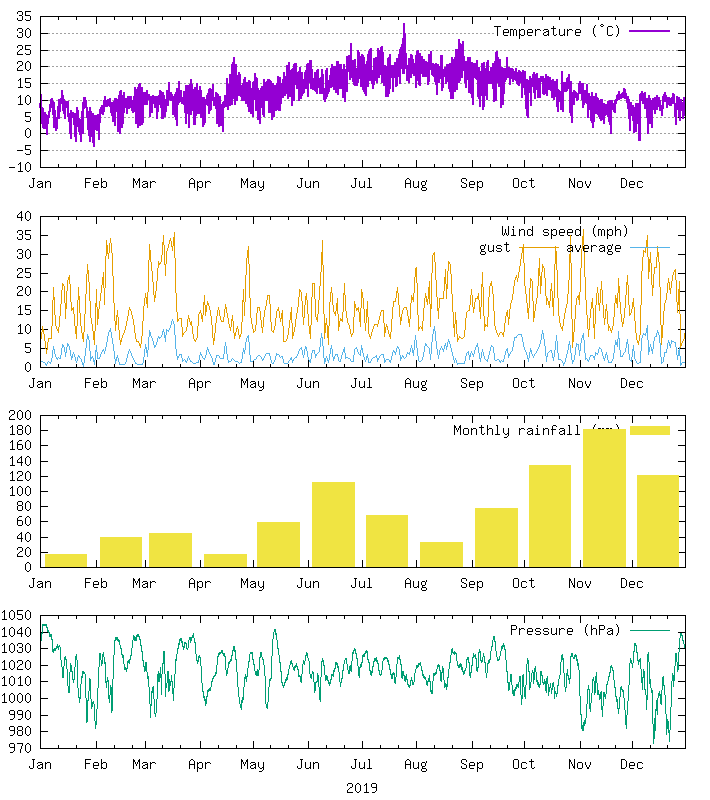
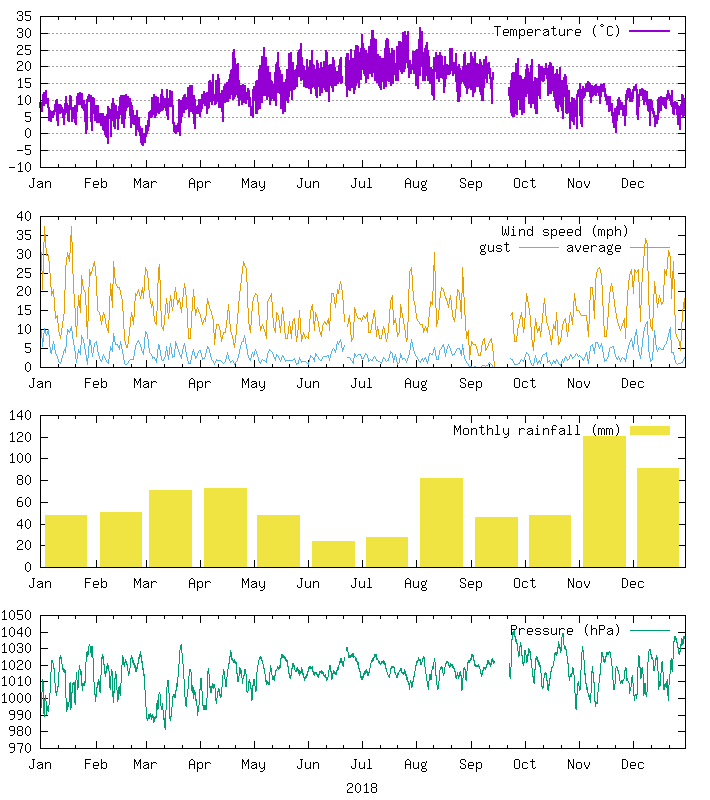
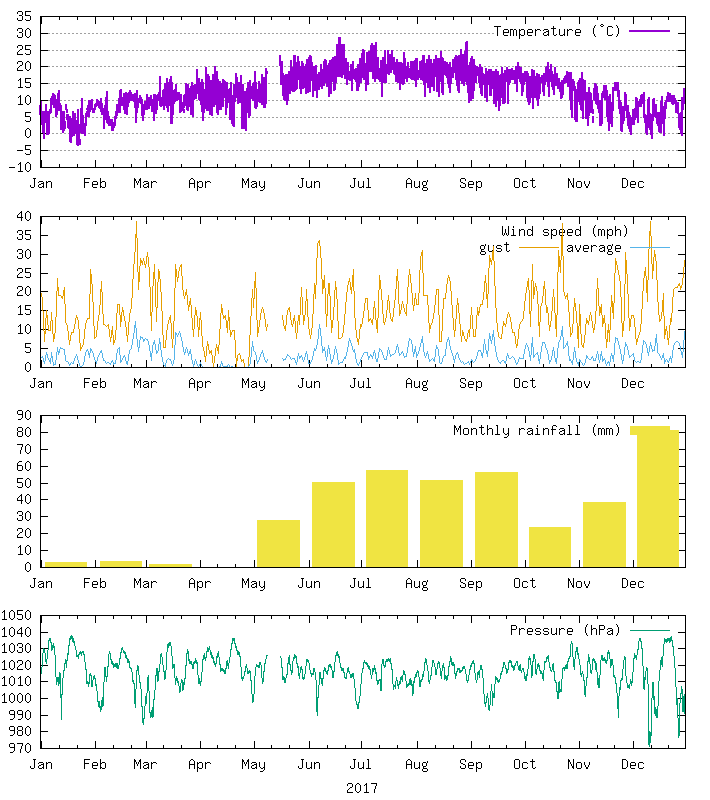
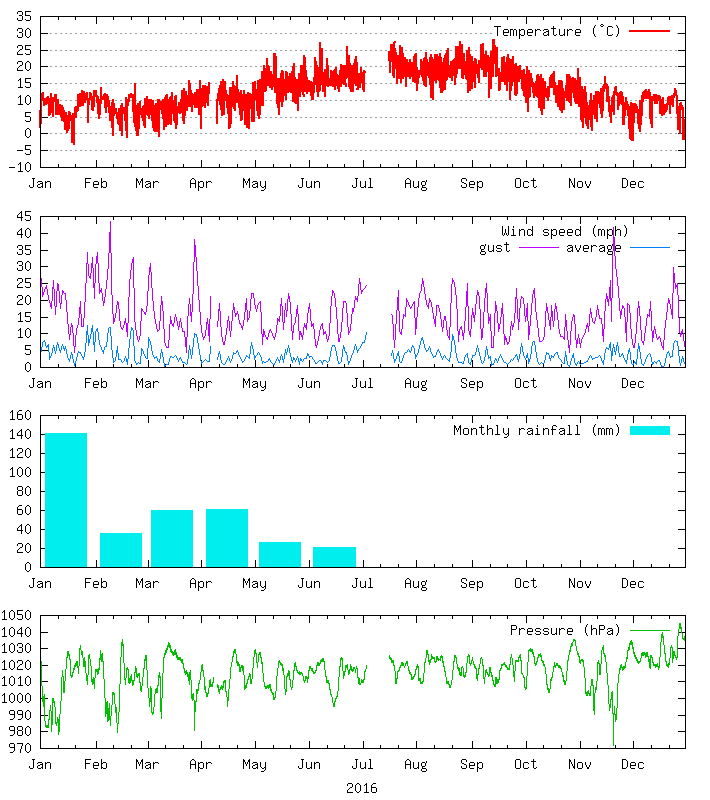
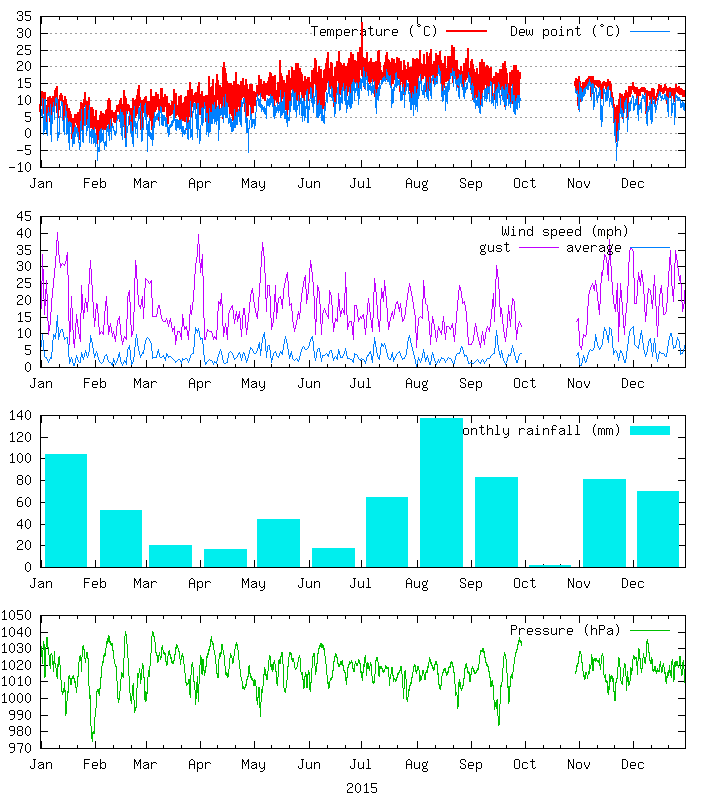
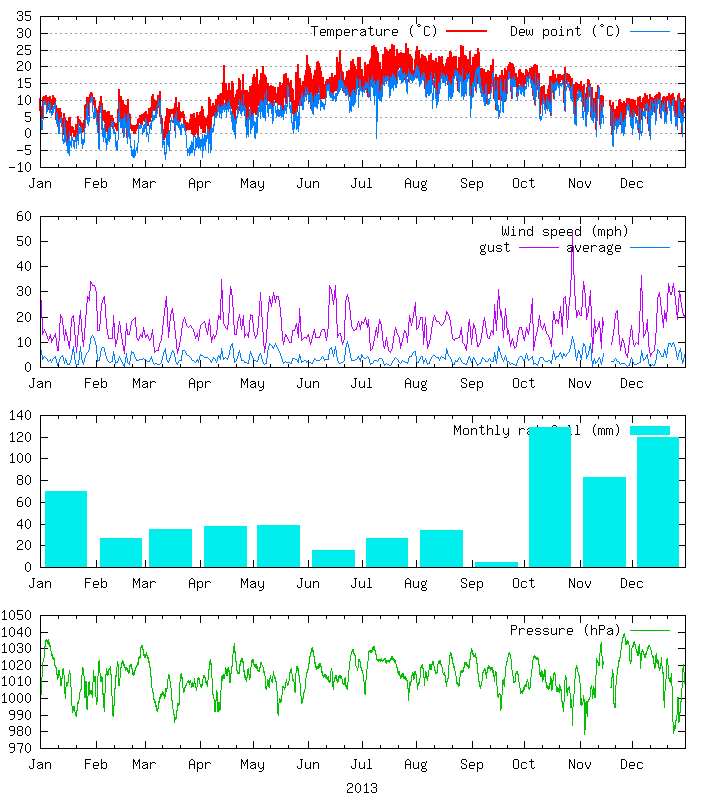
Summaries: The last four weeks, an overview of 2020 so far, and historic graphs for 2019, 2018, 2017, 2016, 2015, 2014, 2013, 2012.
Tables
Weather today and yesterday
| Today | Date & time | ||
|---|---|---|---|
| Day max | 21.8 °C | 14 Sep | 1004 |
| Night min | |||
| Total rain | 0.0 mm | ||
| Avg wind speed | 2 mph | ||
| Fastest gust | 5 mph | 14 Sep | 1009 |
| Yesterday | Date & time | ||
|---|---|---|---|
| Day max | 22.9 °C | 13 Sep | 1644 |
| Night min | 11.4 °C | 14 Sep | 0649 |
| Total rain | 0.0 mm | ||
| Avg wind speed | 1 mph | ||
| Fastest gust | 15 mph | 13 Sep | 1004 |
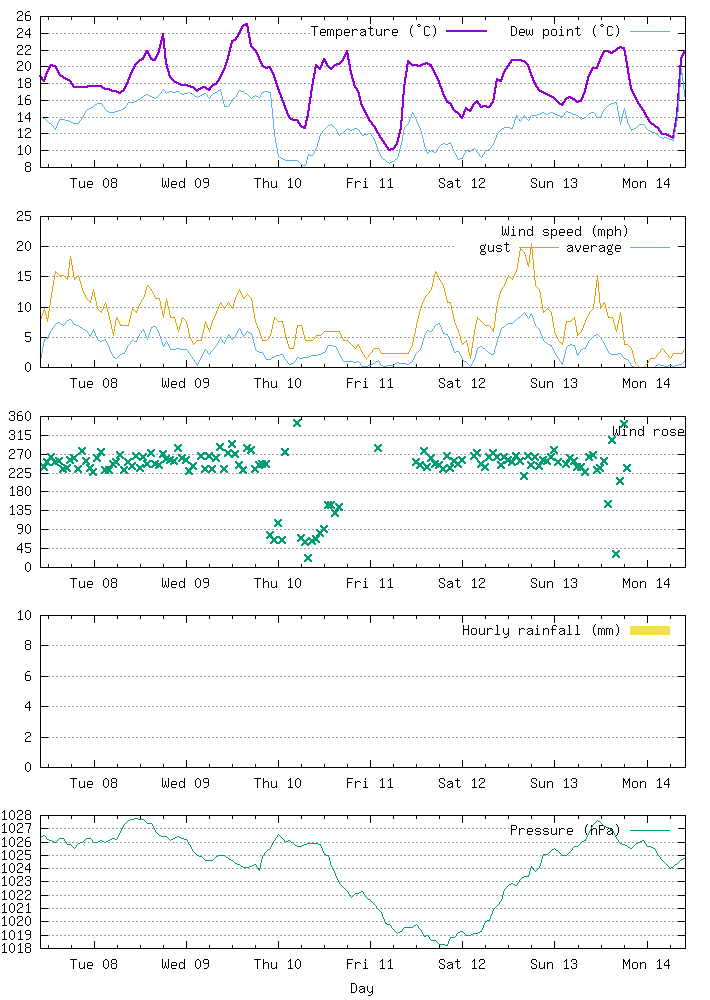
The last week's weather
| 24 hours ending (BST) | Temperature (°C) | Wind (mph) | Rainfall (mm) | |||
|---|---|---|---|---|---|---|
| day max | night min | dir | avg | max gust | ||
| 13 Sep 09:59 | 21.8 | 15.0 | WSW | 5 | 21 | 0.0 |
| 12 Sep 09:59 | 21.0 | 13.7 | WSW | 4 | 16 | 0.0 |
| 11 Sep 09:55 | 22.2 | 9.9 | SE | 1 | 6 | 0.0 |
| 10 Sep 09:55 | 25.6 | 12.5 | W | 3 | 13 | 0.0 |
| 9 Sep 09:55 | 23.8 | 17.0 | WSW | 4 | 14 | 0.0 |
| 8 Sep 09:55 | 20.6 | 16.8 | WSW | 5 | 18 | 0.0 |
| 7 Sep 09:55 | 20.9 | 9.9 | WSW | 2 | 12 | 0.0 |
Historic monthly totals
| Month | Temperature (°C) | Rainfall (mm) | |||||
|---|---|---|---|---|---|---|---|
| daytime maximum | nighttime minimum | ||||||
| high | avg | low | high | avg | low | ||
| Sep 2020 | 25.6 | 21.8 | 20.0 | 17.2 | 13.1 | 9.9 | 1.8 |
| Aug 2020 | 33.6 | 24.4 | 19.3 | 21.3 | 16.5 | 9.5 | 41.7 |
| Jul 2020 | 30.0 | 22.2 | 18.4 | 18.6 | 14.1 | 10.2 | 24.6 |
| Jun 2020 | 26.9 | 21.0 | 15.1 | 20.5 | 13.4 | 8.3 | 43.5 |
| May 2020 | 25.1 | 18.5 | 12.4 | 14.5 | 9.6 | 2.8 | 2.7 |
| Apr 2020 | 20.6 | 16.2 | 11.0 | 11.2 | 7.9 | 3.9 | 41.7 |
| Mar 2020 | 13.8 | 11.3 | 8.3 | 10.6 | 5.8 | 1.0 | 58.8 |
| Feb 2020 | 13.1 | 10.8 | 9.1 | 11.0 | 6.5 | 0.1 | 98.7 |
| Jan 2020 | 12.3 | 10.1 | 6.9 | 11.1 | 6.6 | -0.1 | 42.3 |
| Dec 2019 | 12.5 | 10.4 | 8.0 | 11.0 | 5.8 | -2.1 | 121.2 |
| Nov 2019 | 15.7 | 11.3 | 8.2 | 12.8 | 6.6 | 0.0 | 181.2 |
| Oct 2019 | 18.8 | 15.8 | 11.8 | 15.8 | 10.5 | 3.3 | 134.1 |
| Sep 2019 | 24.8 | 20.5 | 18.4 | 18.1 | 13.1 | 7.4 | 77.4 |
| Aug 2019 | 28.1 | 22.9 | 19.3 | 18.9 | 15.0 | 10.4 | 33.3 |
| Jul 2019 | 32.6 | 23.4 | 18.9 | 19.6 | 15.1 | 11.0 | 68.7 |
| Jun 2019 | 27.8 | 20.2 | 12.0 | 18.2 | 13.3 | 9.6 | 111.9 |
| May 2019 | 21.9 | 17.3 | 13.2 | 14.6 | 9.0 | 3.1 | 59.7 |
| Apr 2019 | 22.4 | 14.4 | 9.3 | 11.6 | 7.1 | 0.4 | 16.8 |
| Mar 2019 | 15.9 | 12.7 | 9.9 | 10.2 | 6.7 | 1.8 | 44.7 |
| Feb 2019 | 16.1 | 10.8 | 5.4 | 8.9 | 4.7 | -1.6 | 39.0 |
| Jan 2019 | 12.5 | 7.8 | 4.3 | 9.0 | 2.6 | -3.8 | 17.1 |
| Dec 2018 | 14.4 | 10.7 | 5.3 | 12.8 | 7.4 | 1.3 | 90.9 |
| Nov 2018 | 16.2 | 12.2 | 5.9 | 12.7 | 8.2 | 0.2 | 120.6 |
| Oct 2018 | 22.1 | 17.5 | 9.7 | 17.7 | 9.2 | 1.2 | 48.0 |
| Sep 2018 | 24.7 | 19.9 | 13.5 | 18.1 | 10.4 | 5.0 | 46.2 |
| Aug 2018 | 31.7 | 23.5 | 18.4 | 20.1 | 15.2 | 9.6 | 81.9 |
| Jul 2018 | 31.3 | 26.1 | 19.9 | 21.3 | 16.6 | 13.1 | 27.9 |
| Jun 2018 | 26.6 | 22.0 | 18.0 | 16.3 | 13.3 | 9.6 | 24.0 |
| May 2018 | 27.8 | 20.3 | 13.9 | 17.0 | 10.9 | 5.8 | 48.3 |
| Apr 2018 | 25.0 | 15.0 | 7.9 | 11.5 | 8.7 | 3.5 | 73.2 |
| Mar 2018 | 15.0 | 9.7 | 2.0 | 8.4 | 4.9 | -0.4 | 70.8 |
| Feb 2018 | 12.7 | 7.3 | -0.1 | 8.1 | 2.0 | -3.5 | 50.7 |
| Jan 2018 | 12.6 | 9.6 | 6.2 | 10.3 | 6.0 | -0.2 | 48.3 |
| Dec 2017 | 13.2 | 9.2 | 3.0 | 9.9 | 4.9 | -1.7 | 81.3 |
| Nov 2017 | 18.4 | 12.1 | 5.1 | 13.9 | 5.8 | -0.4 | 38.7 |
| Oct 2017 | 21.1 | 17.7 | 14.9 | 16.1 | 11.5 | 3.5 | 23.4 |
| Sep 2017 | 23.0 | 19.6 | 17.4 | 17.3 | 12.5 | 7.0 | 56.1 |
| Aug 2017 | 28.3 | 22.4 | 15.2 | 18.3 | 14.3 | 9.2 | 51.3 |
| Jul 2017 | 27.1 | 23.2 | 19.8 | 18.8 | 15.9 | 11.3 | 57.3 |
| Jun 2017 | 28.9 | 22.1 | 17.7 | 17.6 | 14.4 | 10.9 | 50.1 |
| May 2017 | 24.1 | 19.5 | 13.6 | 16.1 | 11.1 | 7.5 | 27.6 |
| Apr 2017 | 20.7 | 16.0 | 11.8 | 11.1 | 6.5 | 0.9 | 0.0 |
| Mar 2017 | 19.6 | 13.6 | 9.2 | 11.7 | 7.8 | 2.9 | 1.5 |
| Feb 2017 | 14.1 | 9.8 | 3.2 | 10.1 | 6.1 | 1.0 | 3.6 |
| Jan 2017 | 13.9 | 8.0 | 2.2 | 8.8 | 2.6 | -3.5 | 2.7 |
| Dec 2016 | 13.2 | 10.3 | 4.3 | 11.3 | 6.1 | -1.9 | 0.3 |
| Nov 2016 | 17.0 | 11.8 | 7.6 | 13.5 | 5.5 | -2.1 | 0.0 |
| Oct 2016 | 20.0 | 16.6 | 12.1 | 14.0 | 9.6 | 5.8 | 0.0 |
| Sep 2016 | 28.1 | 22.8 | 18.7 | 21.2 | 15.3 | 10.4 | 0.3 |
| Aug 2016 | 27.6 | 23.3 | 18.8 | 19.5 | 15.3 | 10.1 | 0.0 |
| Jul 2016 | 27.4 | 23.6 | 18.3 | 20.2 | 16.1 | 12.7 | 0.0 |
| Jun 2016 | 28.1 | 20.5 | 15.5 | 16.8 | 13.5 | 10.2 | 21.3 |
| May 2016 | 23.9 | 18.7 | 13.1 | 14.2 | 10.6 | 4.6 | 26.1 |
| Apr 2016 | 17.2 | 13.9 | 11.6 | 10.5 | 6.0 | 1.3 | 60.0 |
| Mar 2016 | 15.6 | 11.4 | 7.4 | 8.9 | 4.5 | -0.8 | 59.7 |
| Feb 2016 | 15.2 | 10.2 | 6.1 | 10.8 | 4.7 | -1.3 | 36.3 |
| Jan 2016 | 12.7 | 9.9 | 5.4 | 11.4 | 6.2 | -3.4 | 141.3 |
| Dec 2015 | 15.1 | 13.3 | 10.8 | 13.0 | 10.7 | 1.9 | 72.6 |
| Nov 2015 | 17.5 | 14.0 | 7.7 | 14.9 | 10.5 | -2.4 | 81.0 |
| Oct 2015 | 16.3 | 15.8 | 14.9 | 13.8 | 11.2 | 7.0 | 1.8 |
| Sep 2015 | 22.6 | 19.6 | 14.9 | 16.5 | 11.0 | 7.3 | 82.5 |
| Aug 2015 | 26.1 | 22.5 | 18.4 | 19.5 | 15.3 | 11.1 | 137.1 |
| Jul 2015 | 33.5 | 22.2 | 17.0 | 18.2 | 14.4 | 9.6 | 64.5 |
| Jun 2015 | 26.2 | 21.0 | 15.3 | 18.9 | 12.2 | 7.2 | 17.4 |
| May 2015 | 21.7 | 16.9 | 12.4 | 13.1 | 10.0 | 5.7 | 44.1 |
| Apr 2015 | 21.1 | 15.0 | 10.9 | 11.3 | 6.5 | 2.7 | 16.8 |
| Mar 2015 | 15.9 | 11.6 | 8.2 | 10.3 | 5.5 | 1.1 | 20.1 |
| Feb 2015 | 15.5 | 8.7 | 4.2 | 8.5 | 3.0 | -2.8 | 52.8 |
| Jan 2015 | 13.7 | 9.1 | 4.6 | 11.7 | 4.3 | -2.0 | 104.4 |
| Dec 2014 | 13.1 | 9.5 | 3.6 | 12.3 | 4.9 | -2.2 | 55.2 |
| Nov 2014 | 18.0 | 13.6 | 10.5 | 15.2 | 9.8 | 1.7 | 113.1 |
| Oct 2014 | 21.3 | 17.9 | 13.9 | 17.0 | 13.9 | 7.6 | 54.9 |
| Sep 2014 | 24.6 | 21.5 | 19.3 | 20.5 | 14.0 | 7.5 | 8.7 |
| Aug 2014 | 25.9 | 21.7 | 17.5 | 17.2 | 13.7 | 8.5 | 98.1 |
| Jul 2014 | 29.2 | 24.4 | 16.3 | 20.2 | 15.7 | 10.6 | 43.2 |
| Jun 2014 | 26.0 | 21.5 | 17.4 | 15.9 | 12.6 | 8.1 | 6.3 |
| May 2014 | 22.4 | 17.5 | 13.1 | 14.2 | 10.7 | 4.6 | 46.2 |
| Apr 2014 | 19.1 | 15.5 | 12.5 | 13.0 | 8.2 | 3.4 | 28.5 |
| Mar 2014 | 19.6 | 13.2 | 8.7 | 10.4 | 5.6 | 0.1 | 32.1 |
| Feb 2014 | 13.3 | 10.5 | 8.6 | 9.0 | 6.4 | 3.0 | 132.9 |
| Jan 2014 | 12.6 | 10.3 | 6.0 | 10.9 | 6.1 | -0.1 | 143.1 |
| Dec 2013 | 12.1 | 10.7 | 8.1 | 10.7 | 6.5 | -0.5 | 119.7 |
| Nov 2013 | 15.9 | 11.1 | 7.0 | 12.4 | 5.3 | -1.3 | 82.8 |
| Oct 2013 | 20.9 | 17.2 | 11.5 | 16.8 | 11.7 | 3.8 | 129.3 |
| Sep 2013 | 25.3 | 19.8 | 15.6 | 16.8 | 12.4 | 7.0 | 4.5 |
| Aug 2013 | 27.0 | 23.2 | 19.4 | 17.8 | 14.5 | 9.9 | 33.9 |
| Jul 2013 | 27.2 | 23.5 | 17.1 | 19.6 | 14.9 | 11.1 | 26.7 |
| Jun 2013 | 25.2 | 19.2 | 15.1 | 15.3 | 11.8 | 6.9 | 15.6 |
| May 2013 | 24.0 | 16.4 | 11.2 | 13.4 | 8.6 | 5.8 | 39.0 |
| Apr 2013 | 21.1 | 12.0 | 5.1 | 10.2 | 5.1 | -2.6 | 37.8 |
| Mar 2013 | 13.0 | 6.9 | -0.3 | 7.3 | 2.6 | -1.8 | 34.8 |
| Feb 2013 | 13.0 | 6.6 | 2.2 | 8.7 | 2.4 | -1.0 | 26.7 |
| Jan 2013 | 12.2 | 7.3 | 0.7 | 10.4 | 4.0 | -3.3 | 69.9 |
| Dec 2012 | 12.3 | 9.2 | 5.0 | 11.8 | 5.1 | -2.9 | 163.8 |
| Nov 2012 | 14.4 | 11.6 | 5.5 | 12.5 | 6.4 | -1.0 | 97.5 |
| Oct 2012 | 17.9 | 14.7 | 9.1 | 13.7 | 9.5 | 0.8 | 77.4 |
| Sep 2012 | 24.7 | 19.8 | 13.9 | 17.2 | 11.5 | 5.3 | 90.6 |
| Aug 2012 | 29.1 | 22.4 | 19.4 | 18.7 | 15.3 | 6.8 | 33.0 |
| Jul 2012 | 27.9 | 21.0 | 16.3 | 17.0 | 14.1 | 10.5 | 65.1 |
| May 2012 | 27.9 | 17.0 | 10.1 | 16.2 | 9.6 | 4.2 | 27.6 |
| Apr 2012 | 16.9 | 13.1 | 9.2 | 11.2 | 6.2 | -0.2 | 74.1 |
| Mar 2012 | 21.5 | 13.4 | 8.4 | 8.5 | 5.5 | 1.9 | 26.4 |
| Feb 2012 | 16.7 | 7.7 | 1.6 | 9.0 | 2.6 | -5.7 | 7.5 |
| Jan 2012 | 13.0 | 9.8 | 2.8 | 10.6 | 5.5 | -1.5 | 50.7 |